Linux系统如何做性能测试?
十一月 18, 2024 [Linux 与系统] #Linux #Shell 与命令行 #obsidian #存储与文件系统 #编译链接Linux系统如何做性能测试?
性能测试:CPU内存,硬盘IO读写,带宽速度,UnixBench
一、CPU物理个数、内核、超线程、多核心
1、登录Terminal,执行:cat /proc/cpuinfo,就会显示出主机的CPU详细参数,如内核、频率、型号等等,以下是我Linux 系统主机的CPU:
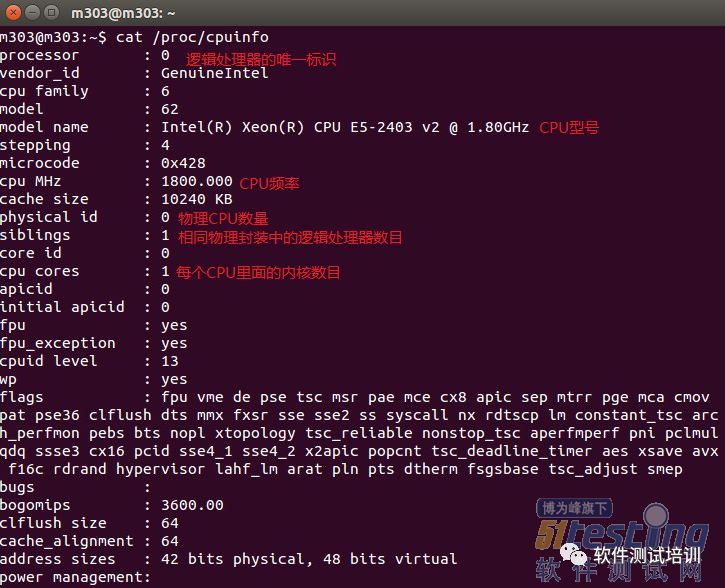
2、主要参数physical_id表示物理CPU个数,cpu cores是内核数,Siblings 表示位于这一物理封装上的逻辑处理器的数量,它们可能支持也可能不支持超线程(HT)技术。
3、如果有一个以上逻辑处理器拥有相同的 core id 和 physical id,则说明系统支持超线程(HT)技术。如果有两个或两个以上的逻辑处理器拥有 相同的 physical id,但是 core id 不同,则说明这是一个多内核处理器。
4、如果“siblings”和“cpu cores”一致,则说明不支持超线程,或者超线程未打开。如果“siblings”是“cpu cores”的两倍,则说明支持超线程,并且超 线程已打开。
5、直接查看逻辑CPU的个数,执行:cat /proc/cpuinfo |grep 'physical id' |sort |uniq
6、直接查看CPU的型号,执行:cat /proc/cpuinfo |grep 'model name' |sort |uniq
7、单个CPU的内核数,执行:cat /proc/cpuinfo |grep 'cpu cores' |sort |uniq
8、总的CPU线程数,执行:cat /proc/cpuinfo |grep 'processor'

** 二、内存大小、交换空间、高速缓存、实际使用内存**
1、查看主机的内存信息,执行:cat /proc/meminfo,主要是看内存大小、交换空间、高速缓存。
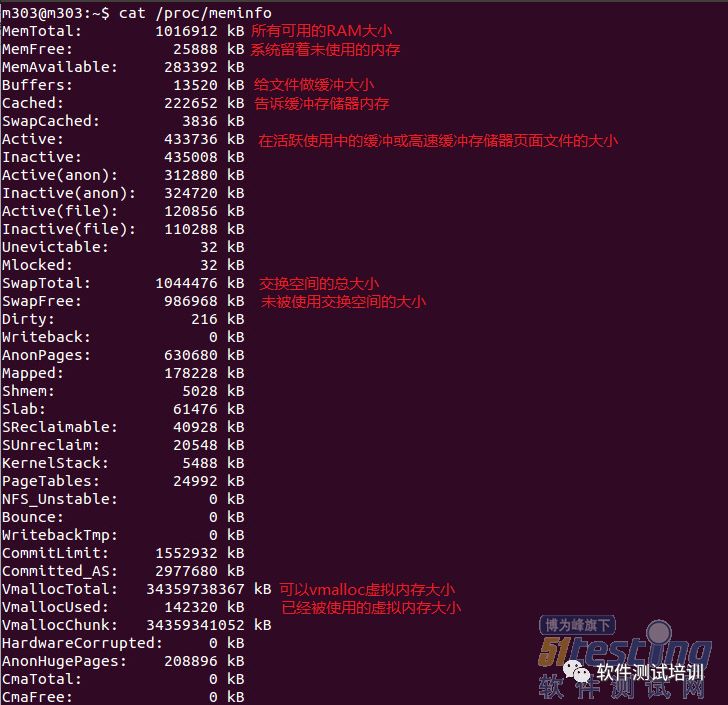

2、主机实际使用内存大小。Linux管理内存的机制是这样的:无论物理内存有多大,Linux 都将其充份利用,将一些程序调用过的硬盘数据读入内存,利用内存读写的高速特性来提高Linux系统的数据访问性能。
3、即Linux会利用空闲的物理内存,划分出一部份空间,做为 cache 和 buffers ,以此提高数据访问性能。cache主要用来减少对磁盘的I/O操作。 所以我们经常能够看到一个总内存为8GB的Linux VPS测试出来占用的内存也是8GB。
4、那么如何才能知道Linux真正占用的内存是多少呢?执行命令:free –m

5、计算主机真实的使用内存方法是:Total-Free-Cached=真实使用内存,即1016912-18584-206944=791384,表示我的主机真实使用的内存是 791384MB。
三、磁盘IO读写速度测试
1、磁盘IO,即输入/输出(Input/Output),这是测试磁盘性能一个重要指标。
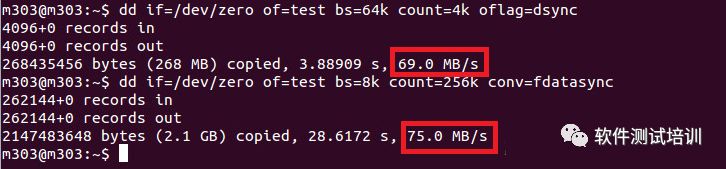
2、测试主机磁盘IO的性能可以执行以下两个命令:
dd if=/dev/zero of=test bs=64k count=4k oflag=dsync
dd if=/dev/zero of=test bs=8k count=256k conv=fdatasync
3、conv=fdatasync与oflag=dsync的区别在于:sync函数只是将所有修改过的块缓冲区排入写队列,然后就返回,它并不等待实际写磁盘操作结束。
4、而fsync函数只对由文件描述符filedes指定的单一文件起作用,并且等待写磁盘操作结束,然后返回。这是我电脑的硬盘IO测试结果。
**四、速度测试:上传下载速度、****服务器**带宽
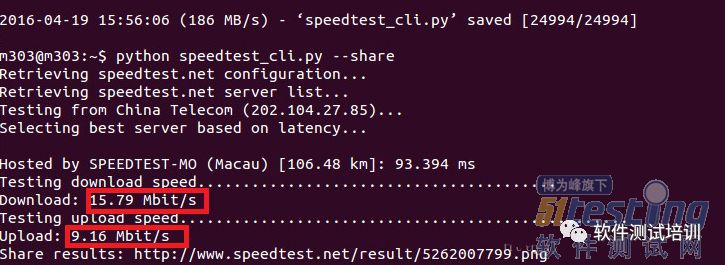
测试VPS主机入口与出口的带宽一键脚本,执行命令:
wget https://github.com/sivel/speedtest-cli/raw/master/speedtest_cli.py
python speedtest_cli.py --share
五、性能综合测试:UnixBench跑分工具测试
1、UnixBench是一款开源的测试 unix 系统基本性能的工具,是比较通用的测试性能的工具,Unixbench的主要测试项目有:系统调用、读写、进程、图形化测试、2D、3D、管道、运算、C库等系统基准性能提供测试数据。
2、UnixBench测试的结果不仅仅只是CPU,内存,或者磁盘为基准,还取决于硬件,操作系统版本,编译器,测试系统各个方面一系列的性能,然后将每个 测试结果和一个基准值进行比较,得到一个索引值,所有测试项目的索引值结合在一起形成一个测试分值。
3、UnixBench测试执行以下命令:
wget http://teddysun.com/wp-content/uploads/unixbench.sh
chmod +x unixbench.sh
./unixbench.sh
4、测试时间可能会比较长,请耐心等待。最后UnixBench会详细列出各个测试项目的得分情况,以及主机性能的综合跑分结果。 如下图,得分为879.7。
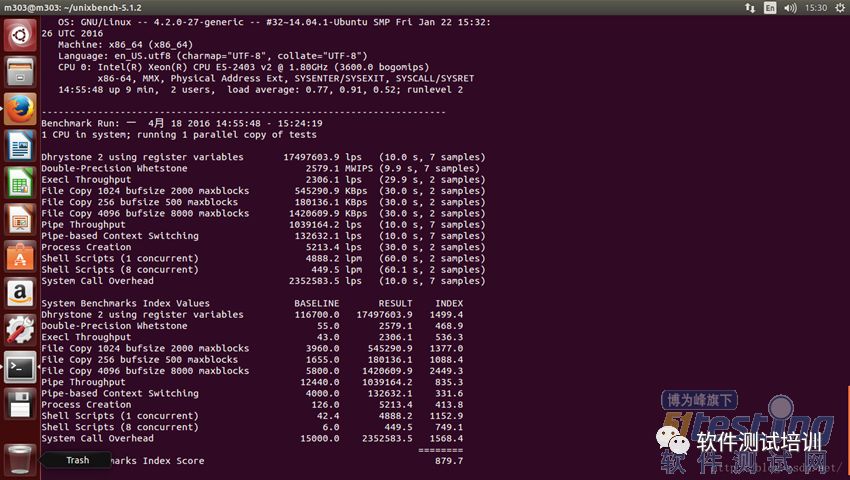
这些测试的结果有一个指数值(INDEX ,如520),这个值是测试系统的测试结果与一个基线系统测试结果比较得到的指数值,这样比原始值更容易得到参考价值,测试集合里面所有的测试得到的指数值结合起来得到整个系统的指数值。
fio
apt install fio
# 结果分析,看 IOPS 即可,值越大,性能越好
# 测试随机读 IOPS
fio --ioengine=libaio --bs=4k --direct=1 --thread --time_based --rw=randread --filename=/tmp/randread.txt --runtime=60 --numjobs=1 --iodepth=1 --group_reporting --name=randread-dep1 --size=1g
# 测试随机写 IOPS
fio --ioengine=libaio --bs=4k --direct=1 --thread --time_based --rw=randwrite --filename=/tmp/randwrite.txt --runtime=60 --numjobs=1 --iodepth=1 --group_reporting --name=randread-dep1 --size=1g

# 结果分析,看 BW 即可,值越大,性能越好
# 测试顺序读
fio --ioengine=libaio --bs=4k --direct=1 --thread --time_based --rw=read --filename=/tmp/read.txt --runtime=60 --numjobs=1 --iodepth=1 --group_reporting --name=randread-dep1 --size=1g
# 测试顺序写
fio --ioengine=libaio --bs=4k --direct=1 --thread --time_based --rw=write --filename=/tmp/write.txt --runtime=60 --numjobs=1 --iodepth=1 --group_reporting --name=randread-dep1 --size=1g

# WAL 文件系统调用 fsync 的延迟分布,当 99% 样本的同步时间小于 10 毫秒就可以认为存储性能能够满足 etcd 的性能要求。
fio --rw=write --ioengine=sync --fdatasync=1 --directory=etcd-bench --size=22m --bs=2300 --name=etcd-bench
slat Submission latency (min being the minimum, max being the maximum, avg being the average, stdev being the standard deviation). This is the time it took to submit the I/O. For sync I/O this row is not displayed as the slat is really the completion latency (since queue/complete is one operation there). This value can be in nanoseconds, microseconds or milliseconds — fio will choose the most appropriate base and print that (in the example above nanoseconds was the best scale).Note: in --minimal mode latencies are always expressed in microseconds. clat Completion latency. Same names as slat, this denotes the time from submission to completion of the I/O pieces. For sync I/O, clat will usually be equal (or very close) to 0, as the time from submit to complete is basically just CPU time (I/O has already been done, see slat explanation). lat Total latency. Same names as slat and clat, this denotes the time from when fio created the I/O unit to completion of the I/O operation.
Now, from these descriptions, I do not understand what is the relation (if there is one) between lat, clat and slat. While websites (https://tobert.github.io/post/2014-04-17-fio-output-explained.html) suggest that lat !=clat+slat, I would still like to have this somehow clarified. This can be either by improving the documentation, or at least by explaining better how those are computed so that one can make his understanding.